
Custom Dashboard Development for Mumbai Businesses: Data That Drives Decisions
Custom Dashboard Development for Mumbai Businesses: Data That Drives Decisions
Here is a paradox I have been thinking about lately. We live in an era where businesses generate more data than at any point in human history. Mumbai alone processes millions of transactions every single day across its financial markets, retail outlets, logistics networks, and service businesses. Yet most business owners I talk to still make decisions based on gut feeling, last month's spreadsheet, or whatever their accountant tells them over chai.
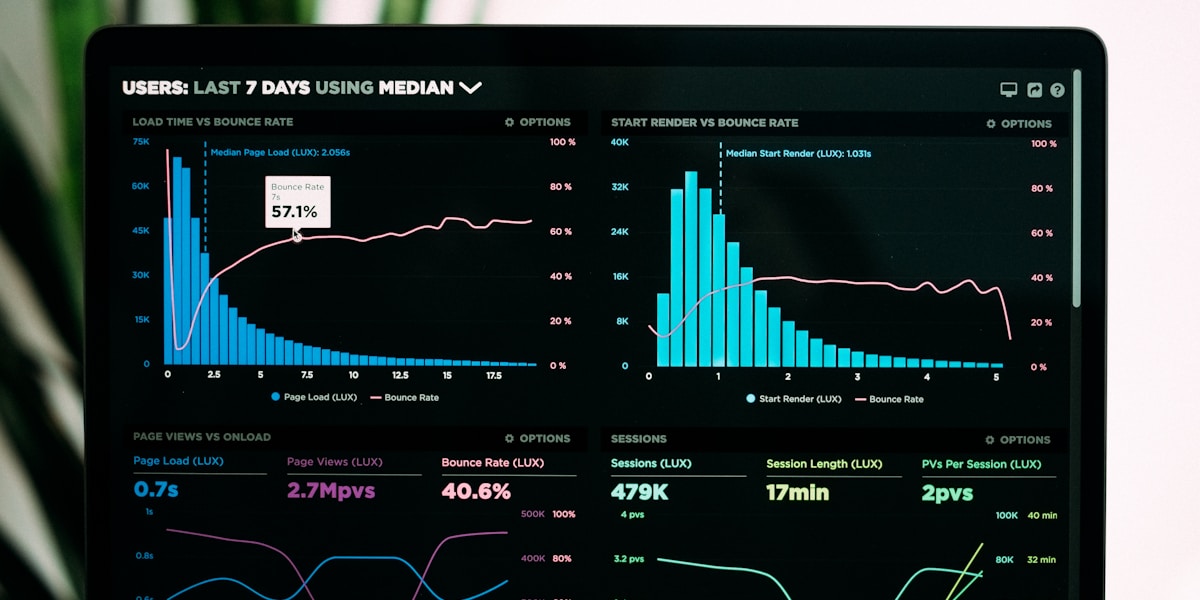
The thing is, data without context is just noise. Numbers without visualization are just clutter. And spreadsheets with fifty tabs are not analytics — they are anxiety generators. I currently think the gap between having data and actually using that data to drive decisions is one of the biggest competitive disadvantages for Mumbai businesses. You might have a POS system generating sales data, a website tracking visitor behavior, an accounting tool recording every rupee, and a CRM logging every customer interaction. But none of that matters if you cannot see the patterns, the trends, and the anomalies in one clear view.
This is exactly where custom dashboard development comes in. A well-built dashboard does not just display numbers — it tells a story. It highlights what needs attention right now, what is trending in the right direction, and where things are about to go wrong. Think of it as the cockpit of your business. A pilot does not fly a plane by looking at raw instrument readings scattered across the cockpit. They look at a dashboard that synthesizes everything into actionable information. Your business deserves the same thing.
Now let's assume you are running a mid-sized retail chain in Mumbai with twelve stores across Andheri, Bandra, and Lower Parel. You have sales data, inventory data, foot traffic data, and employee performance data. Without a dashboard, you are probably reviewing this data in monthly reports — which means by the time you notice a problem, it has already cost you lakhs. With a custom dashboard, you could see real-time sales by store, inventory levels that need restocking, peak shopping hours, and which products are flying off shelves versus collecting dust. That is the difference between reacting to problems and preventing them.
But let me be honest about something before we go deeper. Not every business needs a custom dashboard. Some businesses genuinely work fine with off-the-shelf tools. The question is figuring out where you fall on that spectrum. And that is what this article is going to help you figure out. We will explore the types of dashboards, the development process, the technology options, real examples from Mumbai businesses, and the cost involved. By the end, you will have a clear picture of whether custom dashboard development is worth the investment for your specific situation.
Why Mumbai Businesses Need Custom Dashboards
Let me start with an assumption I hear all the time. 'We already have Excel. Why do we need anything else?' And honestly, this is a fair question. Excel is powerful. It is flexible. Most business owners in Mumbai have been using it for years. But here is the trade-off with Excel: it works perfectly until it does not. And when it stops working, it usually stops catastrophically.
I currently think there are three clear signals that you have outgrown Excel for your data needs. First, when your spreadsheet takes more than thirty seconds to open because it has too many rows. Second, when you spend more time formatting reports than analyzing them. Third, when multiple team members need access to the same data but you are emailing different versions back and forth like it is 2005. If any of these sound familiar, you have already passed the point where Excel is helping you and entered the territory where it is actively holding you back.
Now let's assume you have tried off-the-shelf tools. Maybe you signed up for Google Data Studio, Power BI, or Tableau. These are excellent platforms. But here is the thing about off-the-shelf analytics tools — they are designed for the average case. They work great if your data comes from standard sources, follows standard formats, and you need standard visualizations. But Mumbai businesses are not average. They operate in unique market conditions. They deal with multiple currencies, regional tax structures like GST, complex supply chains across Maharashtra, and business models that do not fit neatly into Western SaaS templates.
Consider a typical Mumbai garment manufacturer who sells through three channels — wholesale to retailers, direct to consumers through their own stores, and online through multiple marketplaces. Each channel has different pricing structures, different return rates, different payment terms, and different margin calculations. An off-the-shelf tool might let you connect to two of these sources. A custom dashboard connects to all three and gives you a unified view of profitability across every channel. That is not a nice-to-have. That is the difference between knowing your actual margins and guessing at them.
The other reason custom dashboards matter in Mumbai specifically is the speed of business here. Mumbai does not wait. Real estate deals close in hours, not weeks. Restaurant supply chains need to adapt to daily demand fluctuations. Financial services need real-time monitoring. When your competitor is making decisions based on today's data and you are looking at last week's report, you are already behind. A custom dashboard gives you the ability to monitor your business in real-time, set up alerts for anomalies, and respond to market changes before they become problems.
There is also a privacy and data sovereignty angle to this that I think about often. When you use off-the-shelf cloud analytics tools, your business data sits on servers you do not control. For some businesses, this is fine. But for others — especially those handling sensitive financial data, healthcare information, or government contracts — having your dashboard hosted on your own infrastructure or a trusted Indian cloud provider is not just a preference. It is a compliance requirement. Custom dashboard development gives you full control over where your data lives and who can access it.
The final consideration is scalability. Off-the-shelf tools often charge per user, per data source, or per query volume. As your business grows, these costs can escalate quickly. A Mumbai SaaS company with fifty employees using Power BI Premium might be paying over a lakh per month in licensing fees. A custom dashboard with the same functionality, once built, has minimal ongoing costs — server hosting, maintenance, and occasional feature updates. The economics shift dramatically in favor of custom development once you reach a certain scale. The trade-off is the upfront investment versus the long-term savings, and for businesses that plan to be around for the next five to ten years, the math usually works out in favor of custom.
Types of Dashboards
Not all dashboards serve the same purpose. I have seen businesses waste money building a single massive dashboard that tries to do everything for everyone. That is like building one room in your house and expecting it to be a kitchen, bedroom, and office simultaneously. It does not work. The first principle of dashboard design is knowing who it is for and what decisions they need to make.
Let me break down the four main types of dashboards that Mumbai businesses typically need. And I want to be clear about something — you might not need all four. The right approach is to identify your most pressing need and start there. You can always expand later.
Operational Dashboards
Operational dashboards are designed for day-to-day monitoring. They answer the question: 'Is everything running as it should right now?' Think of a logistics company in Navi Mumbai that needs to track delivery vehicles, pending shipments, warehouse capacity, and driver availability — all in real-time. This dashboard updates every few minutes and highlights anything that needs immediate attention. It is the dashboard that your operations team looks at every single day, multiple times a day. The key metric here is timeliness. If the data is even an hour old, the dashboard has failed its purpose.
A good operational dashboard for a Mumbai restaurant chain might show real-time orders across all locations, current wait times, inventory levels for key ingredients, and whether any store is experiencing unusual demand patterns. When a sudden crowd forms at the Andheri location because of a nearby event, the operations manager sees it instantly and can redirect staff from the quieter Bandra location. That is operational intelligence in action.
Analytical Dashboards
Analytical dashboards answer a different question: 'Why did this happen?' They are designed for deep dives, trend analysis, and pattern recognition. Unlike operational dashboards that update in real-time, analytical dashboards typically work with historical data and allow users to filter, slice, and drill down into specifics. A Mumbai e-commerce company might use an analytical dashboard to understand why sales dropped 15% in March compared to February. Was it a specific product category? A geographic region? A marketing channel underperforming? The analytical dashboard lets you investigate and find root causes.
The trade-off with analytical dashboards is that they require more sophistication to build and more training to use effectively. They are not the dashboards you glance at while sipping coffee. They are the dashboards you sit with for thirty minutes, ask questions, and emerge with insights that change your strategy. For businesses in Mumbai that are scaling rapidly and need to understand the 'why' behind their numbers, these dashboards are invaluable.
Strategic Dashboards
Strategic dashboards are for leadership teams and business owners. They answer the question: 'Are we moving in the right direction?' These dashboards focus on high-level KPIs — revenue growth, customer acquisition cost, lifetime value, market share, and profitability by segment. A strategic dashboard for a Mumbai fintech startup might track monthly recurring revenue, churn rate, cost per acquisition, and burn rate against fundraising milestones. The data refreshes weekly or monthly because strategic decisions are not made every five minutes. They are made thoughtfully, with the right context.
I currently think strategic dashboards are the most underutilized type among Mumbai SMEs. Most business owners know their numbers vaguely but cannot pull up a real-time view of their business health. They rely on their CA to give them a quarterly summary. But by then, the opportunity to course-correct has often passed. A strategic dashboard puts the pulse of your business at your fingertips.
Executive Dashboards
Executive dashboards are a specific subset of strategic dashboards designed for C-suite leaders who have exactly two minutes to understand the business state. These dashboards are ruthlessly curated. They show five to seven metrics maximum. Each metric has a clear trend indicator — up, down, or stable — and a comparison to the target. A CEO of a Mumbai manufacturing company might see daily revenue vs target, production yield percentage, order backlog, cash position, and customer satisfaction score. That is it. Everything else is a click away if needed, but the dashboard respects the executive's time.
The philosophy behind executive dashboards is simple. The higher up you go in an organization, the less time you have and the more decisions you need to make. Your dashboard should compress maximum insight into minimum space. If your CEO is scrolling through a dashboard, something has gone wrong with the design.
| Dashboard Type | Primary Audience | Update Frequency | Key Question Answered | Complexity |
|---|---|---|---|---|
| Operational | Operations team, store managers | Real-time (minutes) | Is everything running right now? | Medium |
| Analytical | Analysts, department heads | Daily to weekly | Why did this happen? | High |
| Strategic | Leadership team | Weekly to monthly | Are we heading in the right direction? | Medium-High |
| Executive | CEO, founders, board | Daily to weekly | How is the business doing overall? | Medium (design is harder) |
Dashboard Development Process
Building a custom dashboard is not like buying a shirt where you pick a size and color. It is more like building a house. You need a blueprint before you start construction. I have seen businesses rush into dashboard development without proper planning and end up with something that looks impressive but answers the wrong questions. That is a waste of money and time. Let me walk you through the process that actually works.
Discovery: Asking the Right Questions
Before a single line of code is written, good dashboard developers spend time in discovery. This is where they ask questions like: Who will use this dashboard? What decisions do they make daily? What data sources exist? What does success look like three months after launch? The discovery phase is not about technology. It is about understanding the business. I currently think this is the phase that gets skipped most often, and it is the phase that matters most.
A practical example. A Mumbai logistics company came to us wanting a dashboard that showed 'everything about their operations.' That is not a dashboard requirement. That is a wish list. Through discovery, we found out that their real pain point was that dispatchers were spending two hours every morning calling warehouses to check inventory levels before planning routes. The actual need was a real-time inventory visibility dashboard, not an 'everything dashboard.' That single insight saved them weeks of development time and lakhs in cost.
Design: Wireframes Before Pixels
Once you know what questions the dashboard needs to answer, the next step is designing the layout. This typically involves wireframes — rough sketches of where each metric, chart, and filter will sit on the screen. The goal here is not visual beauty. The goal is information hierarchy. What does the user see first? What do they see second? What can they drill into if they want more detail?
The trade-off in dashboard design is always between comprehensiveness and clarity. You can show everything, or you can show what matters. Good design makes the right things prominent and hides the rest behind intuitive navigation. I have a rule of thumb: if someone cannot understand the main story of your dashboard in under five seconds, the design needs work.
Build: Connecting Data and Creating Visualizations
This is where the actual development happens. Data sources get connected — whether that is your ERP system, your POS data, your Google Analytics, your CRM, or your custom database. The data gets cleaned, transformed, and structured in a way that the dashboard can consume it efficiently. Then the visualizations get built — charts, graphs, tables, KPI cards, maps, and whatever else the design calls for.
Now let's assume your data lives in five different systems with five different formats. The build phase is where integration challenges surface. Maybe your POS system exports CSV files manually. Maybe your CRM has an API but it is rate-limited. Maybe your accounting data is in Tally and you need a custom connector. A good development team handles these challenges systematically. A bad one patches them with workarounds that break every month.
Deploy and Iterate
Deployment is not the end. It is the beginning of the useful life of your dashboard. After launch, you collect feedback from actual users. Do they find it intuitive? Are the metrics relevant? Is the data timely enough? Most dashboards go through two to three iterations after the initial launch as users discover what they actually need versus what they thought they needed. The best dashboard development teams build in a feedback mechanism and plan for at least one major iteration cycle post-launch.
One thing I want to emphasize here — a dashboard is not a project with a finish line. It is a living product that needs maintenance, updates, and occasional redesigns as your business evolves. Budget for that from day one. The businesses that treat dashboards as one-time projects end up with stale, useless displays within six months.
A common question I hear during the development process is about data security. When your dashboard connects to multiple data sources, you are essentially creating a central nervous system for your business. That system needs to be secure. Good dashboard development includes role-based access control, so the store manager sees store-level data while the CEO sees company-wide data. It includes data encryption in transit and at rest. It includes audit logs of who accessed what and when. These are not optional features. They are foundational requirements, and they should be part of your development brief from day one.

Technology Stack Options
One of the first decisions in any custom dashboard project is choosing the right technology stack. This is not a decision to make lightly because it affects everything — development cost, performance, maintainability, and your ability to add features later. I currently think most businesses should not make this decision themselves. It should be guided by your development partner based on your specific requirements. But understanding the options helps you have better conversations and make informed choices.
Let me walk you through the main options available for custom dashboard development and where each one shines. The thing is, there is no universally best stack. The best stack for your project depends on your data complexity, your team size, your budget, and how much customization you need.
React + D3.js
This is the power combination for fully custom dashboards. React handles the UI framework — the layout, the interactions, the state management. D3.js handles the data visualization — the charts, the graphs, the custom visual elements. Together, they give you complete creative control. The trade-off is that this stack requires skilled developers. D3.js has a steep learning curve, and building custom visualizations takes time. But the result is a dashboard that looks and works exactly as you envision it, with no limitations imposed by a third-party tool.
For Mumbai businesses that need pixel-perfect dashboards with complex custom visualizations — think real-time geographic maps of delivery routes or intricate financial models — React + D3 is the way to go. The upfront investment is higher, but the long-term flexibility is unmatched.
Retool
Retool is a rapid application development platform specifically designed for building internal tools and dashboards. It provides a drag-and-drop interface with pre-built components that you can connect to your data sources. The advantage is speed. You can build a functional dashboard in days instead of weeks. The disadvantage is that you are working within Retool's component library and design system. If you need something that looks unique or has specific interaction patterns, you will hit limitations.
Now let's assume you are a Mumbai startup that needs an internal dashboard quickly and does not have the budget for a fully custom build. Retool is an excellent choice. It handles authentication, database connections, and API integrations out of the box. Many successful Mumbai startups use Retool for their internal operations dashboards. The key insight here is that Retool is not a compromise — it is the right tool for a specific set of requirements.
Metabase
Metabase is an open-source business intelligence tool that sits between Retool and fully custom development. It provides a clean, intuitive interface for creating dashboards from SQL queries. The biggest advantage is that it is free to self-host, which means your data stays on your infrastructure. For Mumbai businesses that care about data privacy and want a professional-looking dashboard without the cost of a fully custom build, Metabase is worth serious consideration.
The limitation of Metabase is that it is primarily designed for data teams. If your end users are business owners who are not comfortable with SQL, you will need someone to set up the queries and build the dashboards for them. It is not a self-service tool for non-technical users in the same way that some commercial BI tools are.
Custom Next.js Dashboard
For businesses that need a customer-facing dashboard — something that their clients or partners log into — Next.js is an excellent choice. Unlike Retool and Metabase which are internal tools, a Next.js dashboard can be built as a full web application with authentication, role-based access control, and the look and feel of your brand. This is the stack we often recommend for SaaS companies in Mumbai that need to provide dashboards to their customers as part of their product.
| Technology | Best For | Development Speed | Customization Level | Technical Skill Required | Cost Range |
|---|---|---|---|---|---|
| React + D3.js | Complex custom visualizations, unique designs | Slow (4-8 weeks) | Unlimited | High | ₹3-8 lakhs |
| Retool | Internal tools, quick deployment | Fast (1-2 weeks) | Medium | Low-Medium | ₹50K-2 lakhs + subscription |
| Metabase | Data-heavy internal dashboards, self-hosted | Medium (2-4 weeks) | Medium | Medium | Free (open source) + setup cost |
| Custom Next.js | Customer-facing dashboards, SaaS products | Slow (6-12 weeks) | High | High | ₹5-15 lakhs |
| Power BI + Custom | Enterprise reporting with Microsoft ecosystem | Medium (3-5 weeks) | Medium-High | Medium | ₹2-6 lakhs + licensing |
Real Dashboard Examples from Mumbai Businesses
Theory is important, but let me show you what this looks like in practice. I am going to walk through three fictional but realistic case studies based on common scenarios Mumbai businesses face. These are composites of patterns I have observed, and they illustrate how custom dashboards solve real problems.
Case Study 1: Retail Chain Sales Dashboard
GreenLeaf Organics is a fictional organic food retail chain with eight stores across Mumbai. Before getting a custom dashboard, the founder was reviewing sales data exported from eight different POS systems into a massive Excel file every Monday morning. The process took three hours and by the time the analysis was done, the data was already two days old. They were making restocking decisions based on what sold last week, not what was selling right now.
The custom dashboard we built connected directly to all eight POS systems via API and displayed real-time sales data broken down by store, product category, and time of day. Key features included automated alerts when inventory for any product dropped below reorder thresholds, a heat map showing which store had the highest foot traffic at any given hour, and a profitability analysis that compared margins across their private label versus third-party products. The result was a 22% reduction in stockouts within the first quarter and a 15% improvement in inventory turnover. The founder went from spending three hours on data compilation to spending fifteen minutes on actual decision-making.
Case Study 2: Manufacturing Operations Dashboard
Precision Parts Mumbai is a fictional mid-sized manufacturing unit in the MIDC area of Andheri. They produce precision components for the automotive industry. Their biggest challenge was production visibility. The plant manager had to physically walk the floor to check machine status, talk to supervisors to understand output, and rely on manually entered data in Tally to track production against orders. When a machine went down, it sometimes took hours before the impact on delivery timelines was understood.
The operations dashboard pulled data from their ERP system, machine IoT sensors, and quality control databases to create a real-time view of the entire production floor. The dashboard showed machine utilization rates, production output vs targets, quality rejection rates by shift, and delivery timeline predictions based on current production pace. When a CNC machine experienced unexpected downtime, the dashboard immediately flagged it and calculated the downstream impact on three pending orders. The plant manager could then make an informed decision about reallocating work to other machines before the delay cascaded into customer penalties. Production efficiency improved by 18% in six months.
Case Study 3: Marketing Agency Performance Dashboard
BrandFirst Digital is a fictional digital marketing agency based in BKC that manages campaigns for fifteen clients across different industries. Their challenge was reporting. Each account manager was spending eight to ten hours per week manually creating performance reports for clients — pulling data from Google Ads, Facebook Ads, Instagram Insights, and various analytics tools, then formatting it into a presentable report. That is essentially one full workday per week spent on formatting instead of strategy.
The custom dashboard connected to all ad platforms via API and automatically generated client-ready reports. Each client had their own view showing campaign performance across channels, ROI by campaign, lead generation metrics, and trend analysis. Account managers could add annotations to explain performance changes and schedule automatic email delivery of reports to clients weekly. The time spent on reporting dropped from ten hours per week to two hours. But more importantly, the quality of insights improved because account managers had more time to actually analyze and optimize rather than just compile. Client retention improved by 25% because clients received more frequent, more transparent reporting.
Cost and Timeline for Dashboard Development
Let me address the question everyone asks first: How much does it cost? The honest answer is that it depends. But I know that is not helpful when you are trying to budget for a project. So let me give you realistic ranges based on complexity levels, with the caveat that these are estimates for the Mumbai market as of 2026 and will vary based on your specific requirements and the team you work with.
The thing about dashboard pricing is that it correlates directly with three factors: the number of data sources, the complexity of visualizations, and the level of interactivity. A simple dashboard that connects to one data source and shows predefined charts is fundamentally different from a dashboard that connects to ten sources, has custom visualizations, role-based access, and real-time updates. Treating them as the same thing is like saying a bicycle and a motorcycle are both 'vehicles with two wheels.'
| Complexity Level | Description | Typical Timeline | Cost Range (INR) | Best For |
|---|---|---|---|---|
| Basic | Single data source, 5-8 charts, simple filters, standard visualizations | 1-2 weeks | ₹50,000 - ₹1,50,000 | Small businesses, single department |
| Standard | 2-3 data sources, 10-15 charts, interactive filters, custom styling | 2-4 weeks | ₹1,50,000 - ₹4,00,000 | Growing businesses, multi-department |
| Advanced | 4-6 data sources, 15-25 visualizations, real-time updates, role-based access | 4-8 weeks | ₹4,00,000 - ₹8,00,000 | Mid-size enterprises, operations-heavy |
| Enterprise | Unlimited sources, custom visualizations, multi-user, mobile responsive, alerts system | 8-16 weeks | ₹8,00,000 - ₹20,00,000+ | Large enterprises, SaaS products |
| Ongoing Maintenance | Monthly updates, bug fixes, data source changes, feature additions | Monthly retainer | ₹15,000 - ₹80,000/month | All dashboards post-launch |
Now let's assume you are a mid-sized Mumbai business with a budget of around three lakhs. What can you realistically expect? You will likely get a standard-level dashboard with two to three data sources, ten to fifteen visualizations, and basic interactivity. It will take about three to four weeks to build. That is a solid starting point. You can always add features later as you see the value and have budget to expand.
I currently think the biggest cost mistake businesses make is over-engineering from day one. They want every possible feature, every possible integration, and every possible chart before they have even validated that they will use the dashboard regularly. The smarter approach is to build a minimum viable dashboard — the smallest version that solves your most pressing data visibility problem — and then iterate based on actual usage patterns. Start with the dashboard you will look at every day. Add complexity only when you have proven that the base dashboard is valuable.
One more cost factor that people often overlook: the cost of not having a dashboard. If your operations team spends ten hours per week on manual reporting, that is roughly ₹50,000 to ₹1,00,000 per month in salary time depending on seniority. If poor inventory visibility causes even 5% excess stock or stockouts, that can easily be ₹2-5 lakhs per month in lost revenue or carrying costs for a mid-sized business. A dashboard that costs ₹3 lakhs to build and saves ₹1 lakh per month in efficiency gains pays for itself in three months. That is the ROI framework I encourage business owners to use when evaluating this investment.
Common Dashboard Mistakes
Before you invest in dashboard development, let me save you from the mistakes I see businesses make repeatedly. These are not technical mistakes. They are thinking mistakes. And they cost more than any coding error ever will.
The first mistake is building a dashboard for everyone instead of for someone. I have seen dashboards designed by committee where the CEO wants revenue metrics, the ops head wants production metrics, the marketing head wants campaign metrics, and the HR head wants people metrics — all on one screen. The result is a cluttered mess that no one actually uses. The first principle of dashboard design is: one dashboard, one audience, one set of decisions. If different stakeholders need different information, build different dashboards. Yes, it costs more upfront, but each dashboard will actually get used.
The second mistake is choosing the wrong metrics. Vanity metrics — things like total website visitors or social media followers — look impressive but do not drive decisions. A Mumbai e-commerce business might celebrate reaching one lakh monthly visitors while ignoring the fact that conversion rate dropped from 2% to 0.5%. The dashboard should track metrics that connect directly to business outcomes. Revenue, profit margin, customer acquisition cost, retention rate, operational efficiency — these are the metrics that actually matter. If a metric does not lead to a decision, it does not belong on your dashboard.
The third mistake is ignoring mobile. Mumbai business owners are not sitting at their desks all day. They are moving between meetings, visiting sites, traveling across the city. If your dashboard only looks good on a twenty-four-inch monitor, it is useless to someone checking it on their phone during a cab ride. Mobile responsiveness is not optional. It is essential. Build for mobile first, then optimize for desktop.
The fourth mistake is stale data. A dashboard that refreshes once a day is barely better than a weekly report. For operational dashboards, data should be real-time or near-real-time. For strategic dashboards, weekly is acceptable. But if your dashboard shows data that is more than twenty-four hours old for operational decisions, you are building on a broken foundation. Always clarify data refresh requirements during the discovery phase and build the infrastructure to support it.
Conclusion: Your Data Deserves Better Than a Spreadsheet
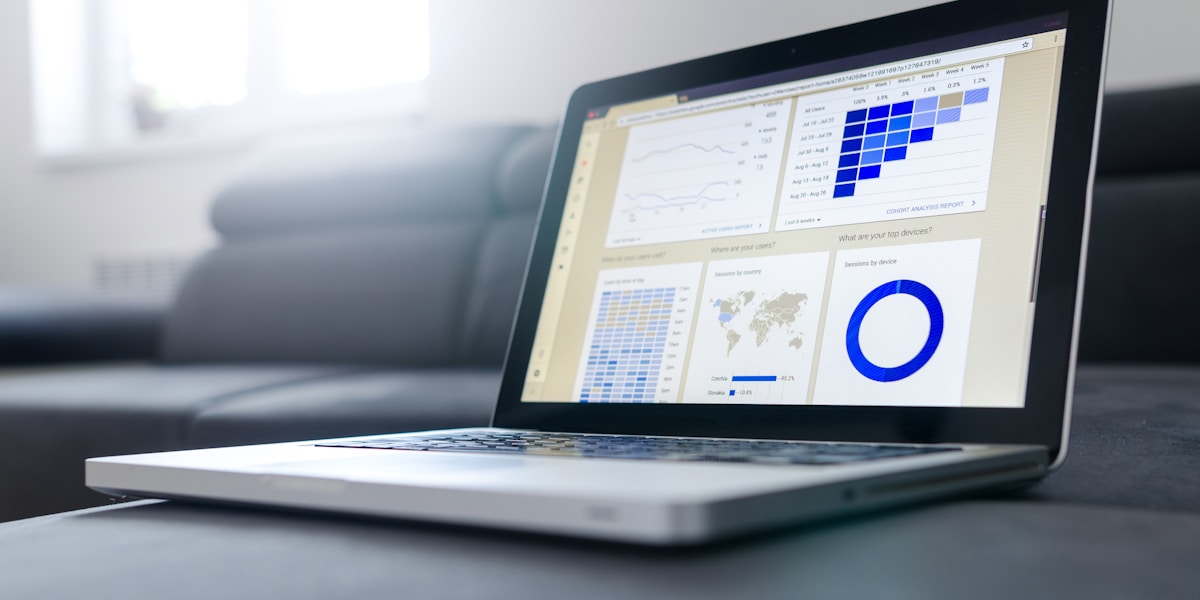
Here is what I want you to take away from this article. Custom dashboard development is not a technology project. It is a business decision. It is the decision to stop guessing and start knowing. To stop reacting to last month's problems and start preventing tomorrow's. To stop spending hours compiling data and start spending minutes understanding it.
Mumbai is a city that moves fast. The businesses that thrive here are the ones that can see clearly, decide quickly, and act decisively. A custom dashboard gives you that clarity. Whether you choose a simple operational dashboard that costs under a lakh or an enterprise-grade analytics platform that costs ten lakhs, the investment pays for itself in better decisions, faster responses, and more efficient operations.
The thing is, you already have the data. It is sitting in your systems right now, waiting to be useful. The question is whether you will continue letting it collect dust in spreadsheets or whether you will transform it into the competitive advantage it was always meant to be.
Need help with your project?
Book a free 30-minute consultation. No sales pitch — just honest advice.
Book a Free Consultation